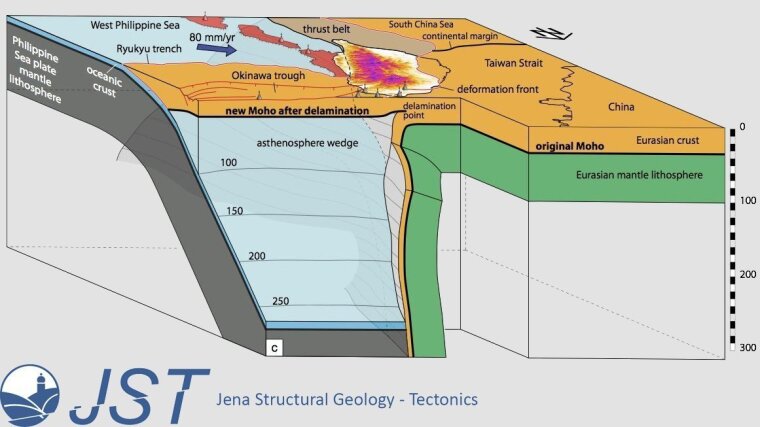
3D animation of crust-mantle boundaries underneath Taiwan. The coloured surfaces represent Moho discontinuities, color-coded according to depth. The plate interface between the Eurasian lithosphere and the base of the Philippine Plate is shown in grey. Earthquakes are represented by dots and small spheres (source: Ustaszewski et al. 2012External link).
Publications
Ustaszewski, K., Wu, Y.-M., Suppe, J., Huang, H.-H., Huang, C.-H., Carena, S.: Crust-mantle boundaries in the Taiwan-Luzon arc-continent collision system determined from local earthquake tomography and 1D models: Implications for the mode of subduction polarity reversal, Tectonophysics, 578, 31-49External link.
MSc theses
Sebastian Cionoiu, 2015: Comparison of the fault-parallel flow and fault-bend folding algorithms, 84 pp.
Tim Knörrich, 2014: 3D-Modellierung eines invertierten Grabensystems anhand einer geologischen Geländeaufnahme am Beispiel des Marisfelder Grabens (Südthüringen), 133 pp.
BSc theses
Spille, Keno, 2020: 3D-Modell von Jena - Geologische Modelle für den 3D-Druck, 26 pp.
Steinle, Adrian, 2018: 3D-Modellierung eines Faltenzugs bei Adorf (Hessen), 52 pp.
Lukas Liebisch, 2016: 3D-Photogrammetrie des Steinbruchs Bad Kösen, Sachsen-Anhalt.
Steffen Ahlers, 2014: Die kinematische Entwicklung der Viernauer-Störungszone südwestlich des Thüringer Waldes.
Sascha Zertani, 2013: Tectonic Analysis of the external Fold-and-Thrust-Belt of the Dinarides in Montenegro; cross section Budva - Podgorica.
Philip Groß, 2012: Tektonische Analyse des externen Überschiebungsgürtels der Dinariden Nordalbaniens; Profilschnitt: Grykes-See - Bukmira.
Sebastian Cionoiu, 2012: Tektonische Analyse des externen Überschiebungsgürtels der Dinariden Nordalbaniens im Bereich der Skutari-Pec-Linie; Profilschnitt Skodra - Bajram Curri.